


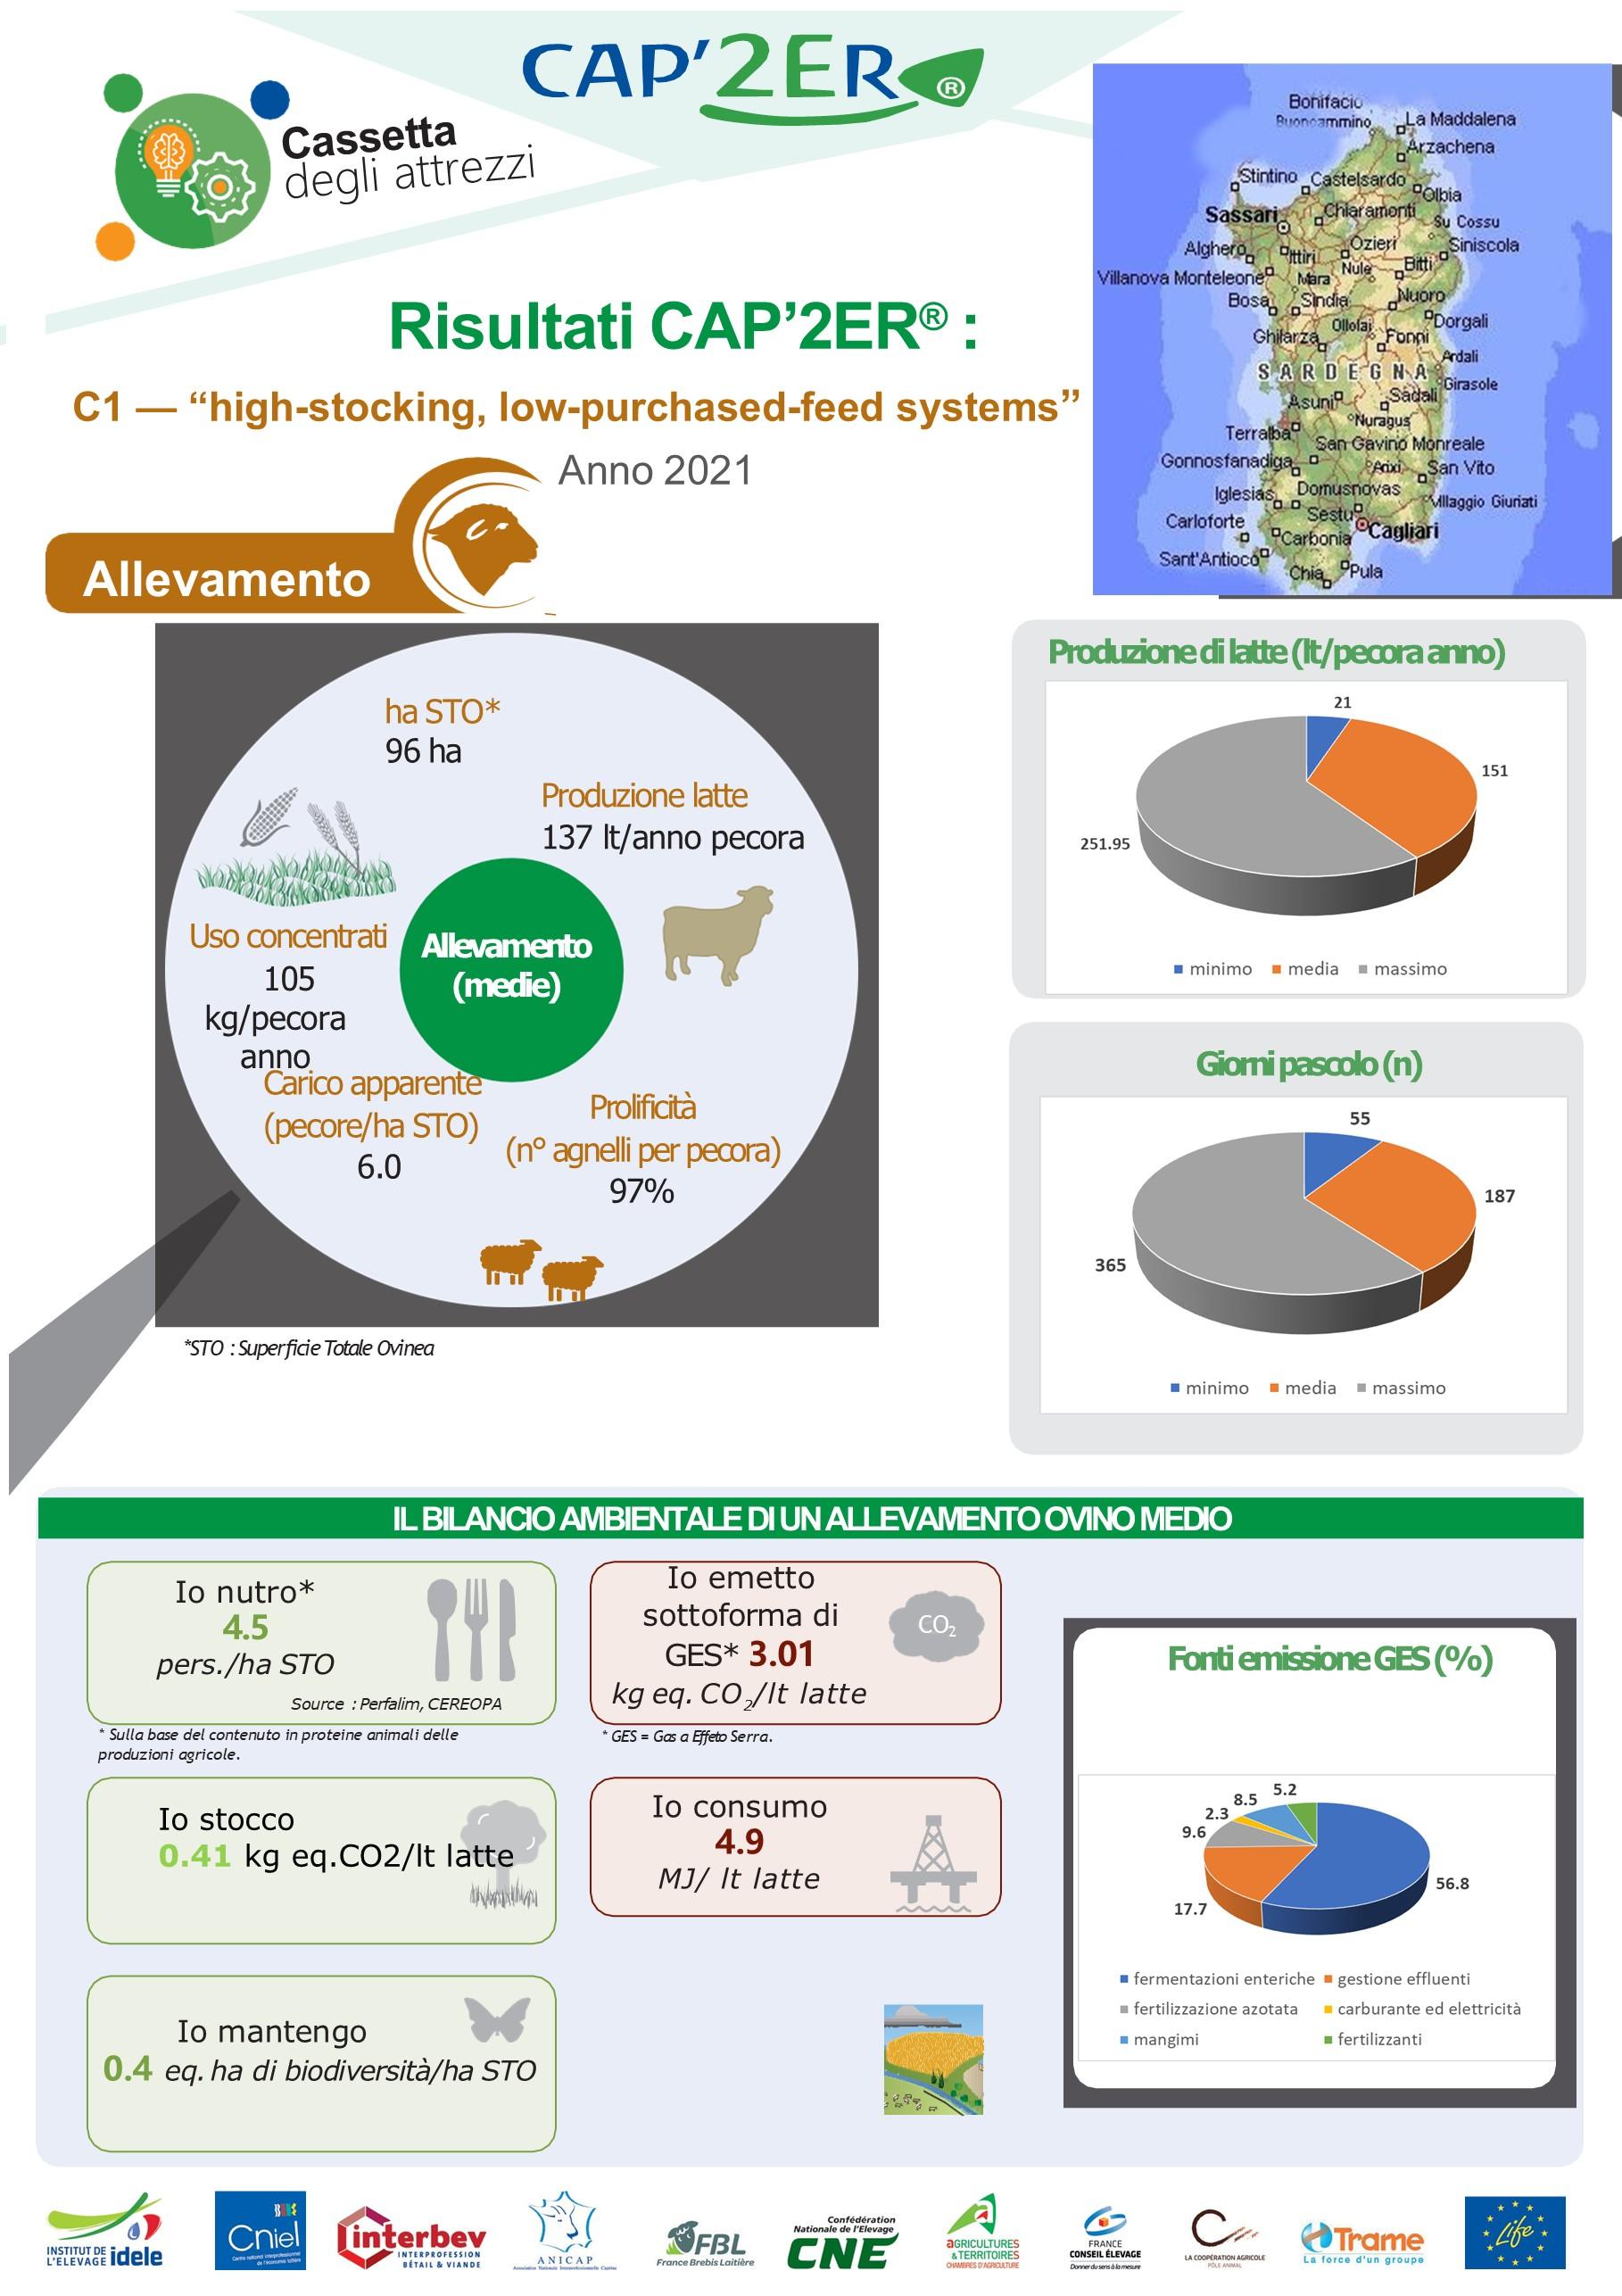
How does my farm compare with others in terms of carbon footprint? To help Italian dairy sheep farmers answer that question, LIFE Green Sheep partners have published four CAP’2ER® reference sheets based on environmental assessments of farms in Sardinia (2021 data).
Four sheets, one toolbox
The sheets are part of the project’s « toolbox » (Cassetta degli attrezzi). One presents the average results for the 102 Italian farms assessed with CAP’2ER®; three others present results for each of the main farming systems identified:
- Italy All Systems
- Italy system_high-stocking, low-purchased-feed systems
- Italy system_Productive, high-input systems
- Italy system_Pastoral, lower-stocking systems
Each sheet combines technical indicators (milk yield, prolificacy, concentrate use, grazing days, energy use) with the farm’s environmental balance: greenhouse gas emissions, carbon storage, energy consumption, biodiversity maintained and the number of people fed per hectare. A blank column lets farmers and advisers enter their own figures and compare them with the reference values.
A tool for advisers and farmers
These benchmarks feed the European observatory of environmental and sustainability performance built by LIFE Green Sheep. They are designed as a starting point for dialogue between farmers and advisers, to identify the most relevant levers on each farm.
LIFE Green Sheep in Italy: global results from Sardinian dairy sheep farms.
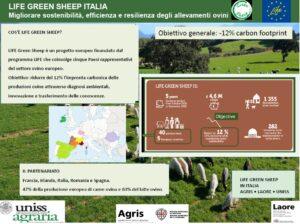
This presentation summarises the work carried out in Italy by AGRIS, LAORE and the University of Sassari (UNISS) within LIFE Green Sheep, a European LIFE project bringing together five countries that account for 47% of EU sheep meat and 63% of EU sheep milk production, with the goal of cutting the carbon footprint of sheep products by 12%. In Sardinia, 35 technicians carried out 102 CAP’2ER® environmental assessments on dairy sheep farms, covering more than 44,000 animals and 8,900 hectares (2021 data). IOn average, the gross carbon footprint of the milk is 3.7 kg CO₂eq per kg of fat- and protein-corrected milk, mainly from enteric fermentation and manure management. Carbon sequestration in grasslands offsets around 31% of emissions, bringing the net footprint down to 2.7 kg CO₂eq/kg, while the farms also contribute to biodiversity maintenance. The large variability between farms points to clear room for improvemen