


A diversity of systems
To date, 90% of the environmental assessments of the demonstrative farms has been carried out by the different project partner countries. The data base includes 373 dairy farms, mainly with semi-extensive rearing systems, and 846 meat farms with a majority of semi-intensive rearing systems (Figure 1). The classification defined at the European scale is based on the stocking rate for the meat sector and the time spent in the barn for the dairy sector. A semi-extensive dairy system means that ewes are outside in fenced pasture most of the time, but housed for a short period during lambing. A semi-intensive meat system means that the stocking rate is between 5 and 11 ewes per hectare. The heterogeneity observed in the distribution of the different rearing systems led to a discussion on the suitability to redefine typologies. Indeed, it looks like the semi-extensive and semi-intensive systems are overrepresented within both sectors. For a better representation of each typology, it could be interesting to redefine them. These potential amendments are currently under discussion.
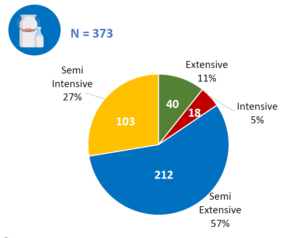
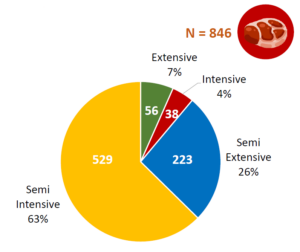
Figure 1 – Distribution of the different rearing systems of the demonstrative dairy farms (on the left) and meat farms (on the right)
Consistent environmental results across countries
The unit commonly used to express greenhouse gas emissions is in kg of CO2 equivalent per unit of product: the liters of milk corrected for protein and fat content (FPCM) in dairy, or the kg of carcass in meat. The results presented below are gross emissions, i.e. carbon storage is not considered. The preliminary results considering carbon storage would possibly lead to different conclusions, but the comparison of carbon storage assessment between tools is still not finished.
The average carbon footprint of the dairy sheep is 3.61 kg eq CO2 / kg FPCM. Emissions from Romanian farms are higher than other countries (Figure 2), because milk productions per ewes are lower (around 60 L/ewe vs. around 250L/ewe in France and Spain for example). The average of GHG emissions in meat farms is 38.1 kg eq CO2 / kg carcass. We are currently analysing the differences between countries to gain a better understanding of the results.
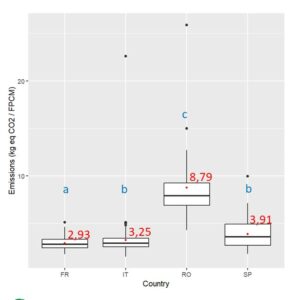
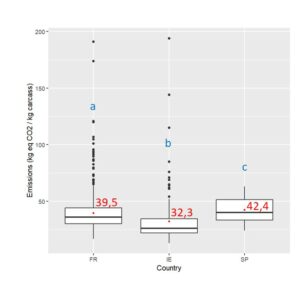
Figure 2 – Gross carbon footprint of dairy (on the left) and meat (on the right) sheep farms according to the different countries, expressed in kg eq CO2 / product unit
Different environmental results across different rearing systems
For dairy farms, there are significant differences between extensive, semi-extensive and semi-intensive systems (Figure 3). The more intensive the system, the more milk it produces, so the lower the GHG emissions (expressed in kg eq CO2 / FPCM). For meat, the differences are less obvious, the pattern is noticeable between extensive/semi-extensive and intensive/semi-intensive (Figure 3).
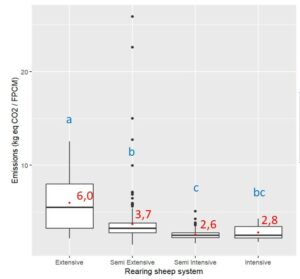
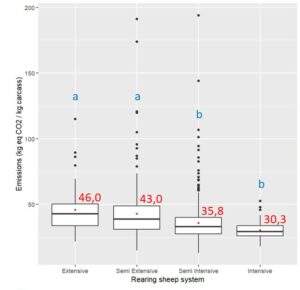
Figure 3 – Gross carbon footprint of dairy (on the left) and meat (on the right) sheep farms according to the different rearing systems, expressed in kg eq CO2 / product unit
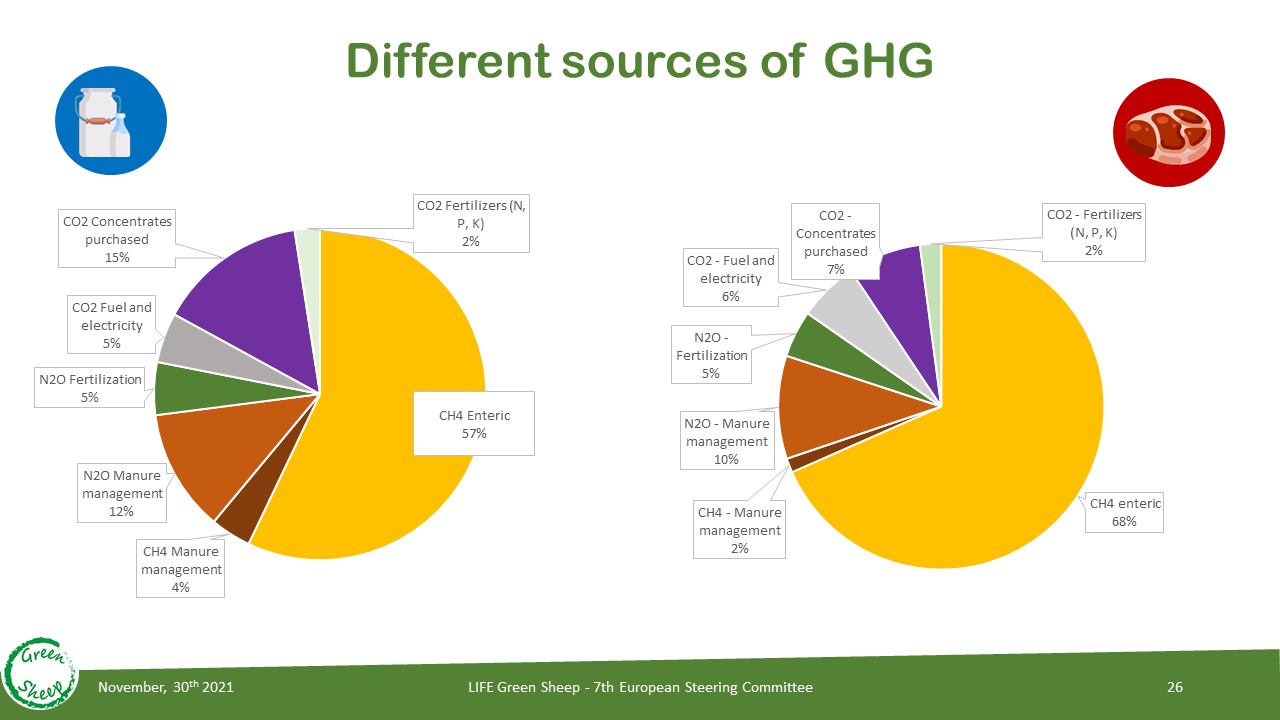
Similar emission sources
In both dairy and meat sectors, the main source of GHG emissions is the enteric fermentation producing methane (Figure 4). It is calculated according to the number of animals present and their diet (intake amount and composition of the diet in particular). Manure management, which released nitrous oxide during spreading and methane during storage, is the second source of emissions (brown). The main difference between dairy and meat is the proportion of purchased concentrates which is higher for the dairy sector (purple).
.
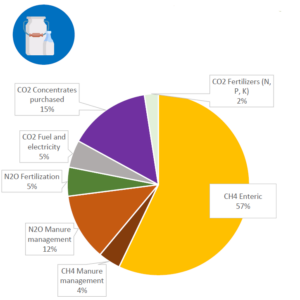
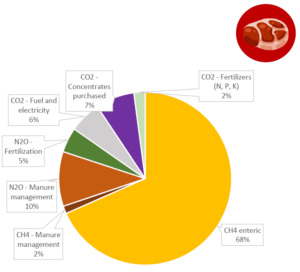
Figure 4 – Distribution of the different GHG emission sources at the farm scale in dairy (on the left) and meat (on the right) sectors